
Ferroptosis Target Information
General Information of the Ferroptosis Target (ID: TAR10040)
| Target Name | NAD(P)H dehydrogenase [quinone] 1 (NQO1) | ||||
|---|---|---|---|---|---|
| Synonyms |
Azoreductase; DT-diaphorase ; Menadione reductase; NAD(P)H:quinone oxidoreductase 1 ; Phylloquinone reductase; Quinone reductase 1
Click to Show/Hide
|
||||
| Gene Name | NQO1 | ||||
| Sequence |
MVGRRALIVLAHSERTSFNYAMKEAAAAALKKKGWEVVESDLYAMNFNPIISRKDITGKL
KDPANFQYPAESVLAYKEGHLSPDIVAEQKKLEAADLVIFQFPLQWFGVPAILKGWFERV FIGEFAYTYAAMYDKGPFRSKKAVLSITTGGSGSMYSLQGIHGDMNVILWPIQSGILHFC GFQVLEPQLTYSIGHTPADARIQILEGWKKRLENIWDETPLYFAPSSLFDLNFQAGFLMK KEVQDEEKNKKFGLSVGHHLGKSIPTDNQIKARK Click to Show/Hide
|
||||
| Family | NAD(P)H dehydrogenase family | ||||
| Function |
Flavin-containing quinone reductase that catalyzes two- electron reduction of quinones to hydroquinones using either NADH or NADPH as electron donors. In a ping-pong kinetic mechanism, the electrons are sequentially transferred from NAD(P)H to flavin cofactor and then from reduced flavin to the quinone, bypassing the formation of semiquinone and reactive oxygen species . Regulates cellular redox state primarily through quinone detoxification. Reduces components of plasma membrane redox system such as coenzyme Q and vitamin quinones, producing antioxidant hydroquinone forms. In the process may function as superoxide scavenger to prevent hydroquinone oxidation and facilitate excretion. Alternatively, can activate quinones and their derivatives by generating redox reactive hydroquinones with DNA cross-linking antitumor potential. Acts as a gatekeeper of the core 20S proteasome known to degrade proteins with unstructured regions. Upon oxidative stress, interacts with tumor suppressors TP53 and TP73 in a NADH-dependent way and inhibits their ubiquitin-independent degradation by the 20S proteasome .
Click to Show/Hide
|
||||
| Gene ID | 1728 | ||||
| Uniprot ID | |||||
| Target Type | Driver Suppressor Marker | ||||
| Mechanism Diagram | Click to View the Original Diagram | ||||
|
|||||
Tissue Relative Abundances of This Target
Full List of Regulator(s) of This Ferroptosis Target and Corresponding Disease/Drug Response(s)
NQO1 can be involved in and affect the ferroptosis by the following regulators, and result in corresponding disease/drug response(s). You can browse corresponding disease or drug response(s) resulting from the regulation of certain regulators.
Browse Regulator related Disease
Browse Regulator related Drug
Transcription factor AP-2-alpha (TFAP2A)
Gallbladder cancer [ICD-11: 2C13]
| In total 1 item(s) under this disease | ||||
| Experiment 1 Reporting the Ferroptosis-centered Disease Response of This Regulator | [1] | |||
| Regulator for Ferroptosis | Suppressor | |||
| Pathway Response | Fatty acid metabolism | hsa01212 | ||
| Ferroptosis | hsa04216 | |||
| Cell Process | Cell ferroptosis | |||
| Cell proliferation | ||||
| Cell migration | ||||
| Cell invasion | ||||
In Vitro Model |
H69 cells | Normal | Homo sapiens | CVCL_8121 |
| GBC-SD cells | Gallbladder carcinoma | Homo sapiens | CVCL_6903 | |
| Response Description | In vitro, gallbladder carcinoma (GBC) exhibited upregulated expression of TFAP2A, whose inhibition reduced GBC cell proliferation, migration, and invasion. Fe2+ and MDA levels were elevated. TFAP2A silencing attenuated the expression of key genes associated with oxidative stress such as heme oxygenase 1 (HO-1), nuclear factor erythroid 2 like 2 (Nrf2), ferritin heavy chain 1 (FTH1) and NAD(P)H quinone dehydrogenase 1 (NQO1). | |||
Unspecific Regulator
Colorectal cancer [ICD-11: 2B91]
| In total 1 item(s) under this disease | |||||
| Experiment 1 Reporting the Ferroptosis-centered Disease Response of This Regulator | [2] | ||||
| Responsed Drug | Propofol | Investigative | |||
| Pathway Response | Fatty acid metabolism | hsa01212 | |||
| Cell Process | Cell ferroptosis | ||||
In Vitro Model |
HT29 cells | Colon cancer | Mus musculus | CVCL_A8EZ | |
| CT26 cells | Colon adenocarcinoma | Mus musculus | CVCL_7254 | ||
| In Vivo Model |
CT26 (1 x 10⁵ cells/100 uL) were injected into thetail veinof male BALB/c mice. Then the mice were randomly divided into saline, vehicle, propofol, and sevoflurane groups (n = 5 per group). Saline, fat emulsion (as vehicle control of propofol), and propofol (200 mg/kg) were intraperitoneally injected, while sevoflurane (1.8-2.0%) was administered by inhalation for 2 h. In another set of experiments, coloncancer cells (CT26 and HT29) were pretreated with two doses of propofol (5 ug/mL, 10 ug/mL) or fat emulsion (as vehicle control of propofol) in a cell culture medium for 2 h. After washing with phosphate-buffered saline (PBS), the cells were harvested,counted on a hemacytometer and prepared. Cells (CT26: 1 x 10⁵ cells/100 uL, HT29: 1 x 10⁶ cells/100 uL) were finnally injected into mice through the tail vein.Lung metastasiswas detected via hematoxylin and eosin staining (HE) or ex vivo bioluminescence imaging.
Click to Show/Hide
|
||||
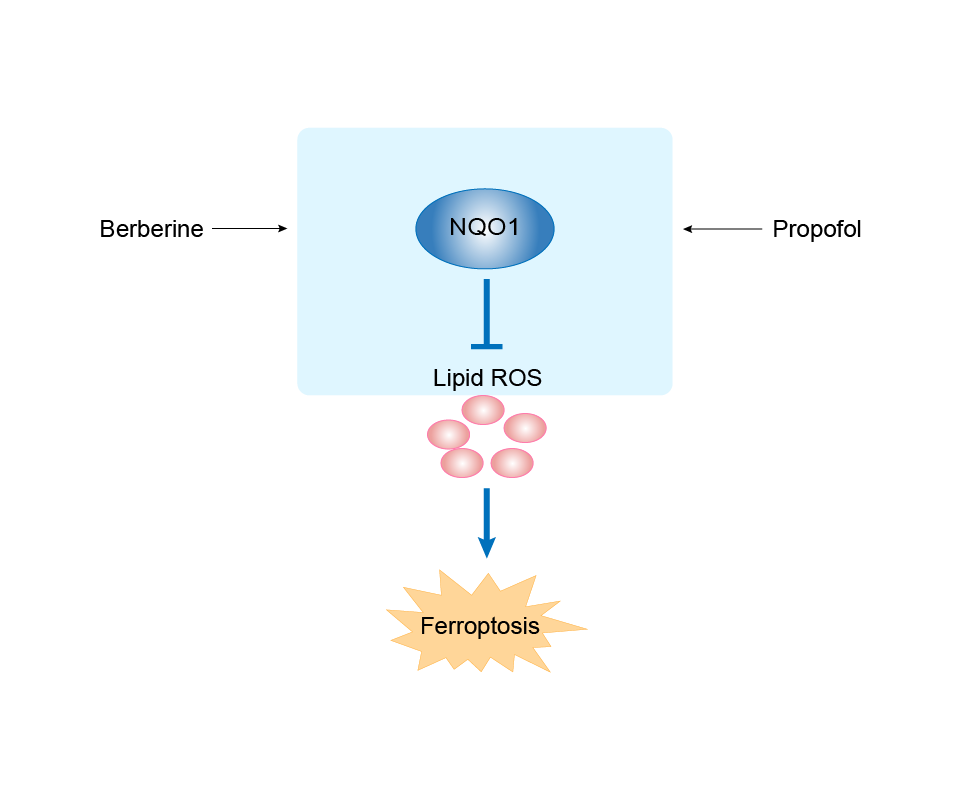
| Response Description | Further studies showed that propofol treatment upregulated the expression of nuclear factor erythroid 2-related factor 2 (Nrf2) and its downstream target genes, including HO-1, NQO1, and SLC7A11. Collectively, we demonstrated the risk of a specific type of anesthetic, propofol, in promoting colorectal cancer cell metastasis through Nrf2-mediated ferroptosis inhibition. | ||||
Cardiomyopathy [ICD-11: BC43]
| In total 1 item(s) under this disease | |||||
| Experiment 1 Reporting the Ferroptosis-centered Disease Response of This Regulator | [3] | ||||
| Responsed Drug | Berberine | Investigative | |||
| Pathway Response | Ferroptosis | hsa04216 | |||
| Fatty acid metabolism | hsa01212 | ||||
| Cell Process | Cell ferroptosis | ||||
In Vitro Model |
CHO-S/H9C2 cells | Normal | Cricetulus griseus | CVCL_A0TS | |
| In Vivo Model |
All animal experiment protocols were implemented in accordance with the National Institutes of Health (NIH) guidelines, and the procedures were approved by the Animal Ethics Committee of Southwest University. C57BL/6J male mice, 8-10 weeks old, weighing 20 ± 2 g, were used in this study. Mice were housed under standard conditions at 22-24 with a 12 h light/12 h darkness cycle and free access to food and tap water. Thirty-six mice were randomly divided into six groups: control (N = 8), IMA group (50 mg/kg) (N = 8), Low-Ber (20 mg/kg) + IMA group (N = 8), Medium-Ber (40 mg kg1) + IMA group (N = 8), High-Ber (80 mg/kg) + IMA group (N = 8), and Fer-1 (1 mg/kg) + IMA group (N = 8). IMA was given intraperitoneally for 14 days. Ber was given orally 2 h before IMA treatment and Fer-1 was given intraperitoneally 2 h before IMA treatment.
Click to Show/Hide
|
||||
| Response Description | Berberine (Ber) downregulated the expression of transferrin receptor (TfR) and P53 and upregulated the expression of nuclear factor erythroid 2-related factor 2 (Nrf2), heme oxygenase-1 (HO-1), NAD(P)H quinone oxidoreductase-1 (NQO1), ferritin heavy chain-1 (FTH1), and glutathione peroxidase 4 (GPX4) in H9c2 cells and mice. The present data indicated that Ber has the potential to protect against imatinib mesylate-induced cardiotoxicity, partlyviainhibiting Nrf2-dependent ferroptosis. | ||||
Unspecific Regulator
Propofol
[Investigative]
| In total 1 item(s) under this drug | |||||
| Experiment 1 Reporting the Ferroptosis-centered Drug Response of This Regulator | [2] | ||||
| Responsed Disease | Colorectal cancer [ICD-11: 2B91] | ||||
| Pathway Response | Fatty acid metabolism | hsa01212 | |||
| Cell Process | Cell ferroptosis | ||||
| In Vitro Model | HT29 cells | Colon cancer | Mus musculus | CVCL_A8EZ | |
| CT26 cells | Colon adenocarcinoma | Mus musculus | CVCL_7254 | ||
| In Vivo Model |
CT26 (1 x 10⁵ cells/100 uL) were injected into thetail veinof male BALB/c mice. Then the mice were randomly divided into saline, vehicle, propofol, and sevoflurane groups (n = 5 per group). Saline, fat emulsion (as vehicle control of propofol), and propofol (200 mg/kg) were intraperitoneally injected, while sevoflurane (1.8-2.0%) was administered by inhalation for 2 h. In another set of experiments, coloncancer cells (CT26 and HT29) were pretreated with two doses of propofol (5 ug/mL, 10 ug/mL) or fat emulsion (as vehicle control of propofol) in a cell culture medium for 2 h. After washing with phosphate-buffered saline (PBS), the cells were harvested,counted on a hemacytometer and prepared. Cells (CT26: 1 x 10⁵ cells/100 uL, HT29: 1 x 10⁶ cells/100 uL) were finnally injected into mice through the tail vein.Lung metastasiswas detected via hematoxylin and eosin staining (HE) or ex vivo bioluminescence imaging.
Click to Show/Hide
|
||||
| Response Description | Further studies showed that propofol treatment upregulated the expression of nuclear factor erythroid 2-related factor 2 (Nrf2) and its downstream target genes, including HO-1, NQO1, and SLC7A11. Collectively, we demonstrated the risk of a specific type of anesthetic, propofol, in promoting colorectal cancer cell metastasis through Nrf2-mediated ferroptosis inhibition. | ||||
Berberine
[Investigative]
| In total 1 item(s) under this drug | |||||
| Experiment 1 Reporting the Ferroptosis-centered Drug Response of This Regulator | [3] | ||||
| Responsed Disease | Cardiomyopathy [ICD-11: BC43] | ||||
| Pathway Response | Ferroptosis | hsa04216 | |||
| Fatty acid metabolism | hsa01212 | ||||
| Cell Process | Cell ferroptosis | ||||
| In Vitro Model | CHO-S/H9C2 cells | Normal | Cricetulus griseus | CVCL_A0TS | |
| In Vivo Model |
All animal experiment protocols were implemented in accordance with the National Institutes of Health (NIH) guidelines, and the procedures were approved by the Animal Ethics Committee of Southwest University. C57BL/6J male mice, 8-10 weeks old, weighing 20 ± 2 g, were used in this study. Mice were housed under standard conditions at 22-24 with a 12 h light/12 h darkness cycle and free access to food and tap water. Thirty-six mice were randomly divided into six groups: control (N = 8), IMA group (50 mg/kg) (N = 8), Low-Ber (20 mg/kg) + IMA group (N = 8), Medium-Ber (40 mg kg1) + IMA group (N = 8), High-Ber (80 mg/kg) + IMA group (N = 8), and Fer-1 (1 mg/kg) + IMA group (N = 8). IMA was given intraperitoneally for 14 days. Ber was given orally 2 h before IMA treatment and Fer-1 was given intraperitoneally 2 h before IMA treatment.
Click to Show/Hide
|
||||
| Response Description | Berberine (Ber) downregulated the expression of transferrin receptor (TfR) and P53 and upregulated the expression of nuclear factor erythroid 2-related factor 2 (Nrf2), heme oxygenase-1 (HO-1), NAD(P)H quinone oxidoreductase-1 (NQO1), ferritin heavy chain-1 (FTH1), and glutathione peroxidase 4 (GPX4) in H9c2 cells and mice. The present data indicated that Ber has the potential to protect against imatinib mesylate-induced cardiotoxicity, partlyviainhibiting Nrf2-dependent ferroptosis. | ||||
References