
Ferroptosis-centered Drug Response Information
General Information of the Drug (ID: ferrodrug0306)
| Name |
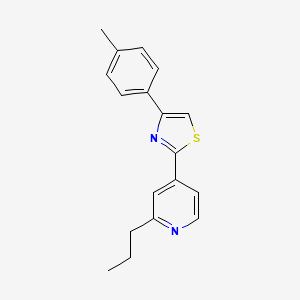
Fatostatin
|
||||
|---|---|---|---|---|---|
| Synonyms |
FATOSTATIN; Fatostatin A; 125256-00-0; 4-(4-methylphenyl)-2-(2-propylpyridin-4-yl)-1,3-thiazole; 2-(2-propylpyridin-4-yl)-4-(p-tolyl)thiazole; CHEMBL1621019; 4-[4-(4-methylphenyl)-1,3-thiazol-2-yl]-2-propylpyridine; MLS000332366; SMR000221636; 2-Propyl-4-(4-p-tolyl-thiazol-2-yl)-pyridine; 4-(4-methylphenyl)-2-(2-propylpyridin-4-yl)-1,3-thiazole;hydrobromide; Fatostatin;125B11; Oprea1_120708; SCHEMBL2742732; BDBM78179; CHEBI:95052; cid_2850562; ZROSUBKIGBSZCG-UHFFFAOYSA-N; AMY41632; BCP20994; s9785; STK326446; AKOS005434229; CS-5810; AC-35652; BS-15072; HY-14452; 2-(2-propyl-4-pyridyl)-4-(p-tolyl)thiazole; D84076; 4-(4-methylphenyl)-2-(2-propyl-4-pyridinyl)thiazole; Q27166821; 2-(2-propyl-4-pyridyl)-4-(p-tolyl)thiazole;hydrobromide; 4-(4-methylphenyl)-2-(2-propyl-4-pyridinyl)thiazole;hydrobromide; 4-(4-METHYLPHENYL)-2-(2-PROPYL-4-PYRIDYL)-1,3-THIAZOLE
Click to Show/Hide
|
||||
| Structure |
 |
||||
| Formula |
C18H18N2S
|
||||
| IUPAC Name |
4-(4-methylphenyl)-2-(2-propylpyridin-4-yl)-1,3-thiazole
|
||||
| Canonical SMILES |
CCCC1=NC=CC(=C1)C2=NC(=CS2)C3=CC=C(C=C3)C
|
||||
| InChI |
InChI=1S/C18H18N2S/c1-3-4-16-11-15(9-10-19-16)18-20-17(12-21-18)14-7-5-13(2)6-8-14/h5-12H,3-4H2,1-2H3
|
||||
| InChIKey |
ZROSUBKIGBSZCG-UHFFFAOYSA-N
|
||||
| PubChem CID | |||||
Full List of Ferroptosis Target Related to This Drug
Phospholipid hydroperoxide glutathione peroxidase (GPX4)
| In total 3 item(s) under this Target | |||||
| Experiment 1 Reporting the Ferroptosis-centered Drug Act on This Target | [1] | ||||
| Target for Ferroptosis | Suppressor | ||||
| Responsed Disease | Glioblastoma | ICD-11: 2A00 | |||
| Responsed Regulator | RAC-alpha serine/threonine-protein kinase (AKT1) | Suppressor | |||
| Pathway Response | Cell adhesion molecules | hsa04514 | |||
| Ferroptosis | hsa04216 | ||||
| Cell Process | Cell ferroptosis | ||||
| Cell proliferation | |||||
| In Vitro Model | U87 MG-Red-Fluc cells | Glioblastoma | Homo sapiens | CVCL_5J12 | |
| U-251MG cells | Astrocytoma | Homo sapiens | CVCL_0021 | ||
| In Vivo Model |
After anesthetizing the nude mice with isoflurane inhalation, we injected 1 x 10⁶ U87 cells that were engineered for the expression of luciferase into the right striatum (3.5 mm from the midline of the brain and 2 mm in front of the coronal suture, injection depth of 3 mm from the brain surface) of the nude mice to establish an intracranial xenograft model. For the detection of pharmacokinetics in mice, RhoB-loaded p28-PLGA NPs were injected into the mice (n = 3) through the tail vein. We collected blood samples at predetermined time points, quantified the RhoB concentrations, and plotted them with time. To characterize NPs for GBM treatment, we randomly divided the tumor-bearing mice into four groups (n = 8) treated with PBS, free fatostatin (25 mg/kg), NPs-FAT (fatostatin equivalent dose at 25 mg/kg), and p28-NPs-FAT (fatostatin equivalent dose at 25 mg/kg). After 7 days of tumor inoculation, the treatment was conducted 3 days per week for 4 weeks. In addition, we performed IVIS imaging of intracranial tumors at 1, 3, and 5 weeks after tumor inoculation to observe tumor progression. IVIS was also used to carry out imaging of IR780-loaded NPs. The mice were monitored regularly and euthanized when they exhibited severe neurological symptoms and/or obvious weight loss (>20% of their body weight). We sacrificed a separate cohort of mice five weeks after tumor inoculation for pathological staining (n = 3).
Click to Show/Hide
|
||||
| Response regulation | Fatostatin induces ferroptosis by inhibiting the AKT/mTORC1/GPX4 signaling pathway in glioblastoma. In addition, fatostatin inhibits cell proliferation and the EMT process through the AKT/mTORC1 signaling pathway. | ||||
| Experiment 2 Reporting the Ferroptosis-centered Drug Act on This Target | [1] | ||||
| Target for Ferroptosis | Suppressor | ||||
| Responsed Disease | Glioblastoma | ICD-11: 2A00 | |||
| Responsed Regulator | Serine/threonine-protein kinase mTOR (MTOR) | Suppressor | |||
| Pathway Response | Cell adhesion molecules | hsa04514 | |||
| Ferroptosis | hsa04216 | ||||
| Cell Process | Cell ferroptosis | ||||
| Cell proliferation | |||||
| In Vitro Model | U87 MG-Red-Fluc cells | Glioblastoma | Homo sapiens | CVCL_5J12 | |
| U-251MG cells | Astrocytoma | Homo sapiens | CVCL_0021 | ||
| In Vivo Model |
After anesthetizing the nude mice with isoflurane inhalation, we injected 1 x 10⁶ U87 cells that were engineered for the expression of luciferase into the right striatum (3.5 mm from the midline of the brain and 2 mm in front of the coronal suture, injection depth of 3 mm from the brain surface) of the nude mice to establish an intracranial xenograft model. For the detection of pharmacokinetics in mice, RhoB-loaded p28-PLGA NPs were injected into the mice (n = 3) through the tail vein. We collected blood samples at predetermined time points, quantified the RhoB concentrations, and plotted them with time. To characterize NPs for GBM treatment, we randomly divided the tumor-bearing mice into four groups (n = 8) treated with PBS, free fatostatin (25 mg/kg), NPs-FAT (fatostatin equivalent dose at 25 mg/kg), and p28-NPs-FAT (fatostatin equivalent dose at 25 mg/kg). After 7 days of tumor inoculation, the treatment was conducted 3 days per week for 4 weeks. In addition, we performed IVIS imaging of intracranial tumors at 1, 3, and 5 weeks after tumor inoculation to observe tumor progression. IVIS was also used to carry out imaging of IR780-loaded NPs. The mice were monitored regularly and euthanized when they exhibited severe neurological symptoms and/or obvious weight loss (>20% of their body weight). We sacrificed a separate cohort of mice five weeks after tumor inoculation for pathological staining (n = 3).
Click to Show/Hide
|
||||
| Response regulation | Fatostatin induces ferroptosis by inhibiting the AKT/ mTORC1/GPX4 signaling pathway in glioblastoma. In addition, fatostatin inhibits cell proliferation and the EMT process through the AKT/mTORC1 signaling pathway. | ||||
| Experiment 3 Reporting the Ferroptosis-centered Drug Act on This Target | [1] | ||||
| Target for Ferroptosis | Suppressor | ||||
| Responsed Disease | Glioblastoma | ICD-11: 2A00 | |||
| Responsed Regulator | Serine/threonine-protein kinase mTOR (MTOR) | Suppressor | |||
| Pathway Response | Cell adhesion molecules | hsa04514 | |||
| Ferroptosis | hsa04216 | ||||
| Cell Process | Cell ferroptosis | ||||
| Cell proliferation | |||||
| In Vitro Model | U87 MG-Red-Fluc cells | Glioblastoma | Homo sapiens | CVCL_5J12 | |
| U-251MG cells | Astrocytoma | Homo sapiens | CVCL_0021 | ||
| In Vivo Model |
After anesthetizing the nude mice with isoflurane inhalation, we injected 1 x 10⁶ U87 cells that were engineered for the expression of luciferase into the right striatum (3.5 mm from the midline of the brain and 2 mm in front of the coronal suture, injection depth of 3 mm from the brain surface) of the nude mice to establish an intracranial xenograft model. For the detection of pharmacokinetics in mice, RhoB-loaded p28-PLGA NPs were injected into the mice (n = 3) through the tail vein. We collected blood samples at predetermined time points, quantified the RhoB concentrations, and plotted them with time. To characterize NPs for GBM treatment, we randomly divided the tumor-bearing mice into four groups (n = 8) treated with PBS, free fatostatin (25 mg/kg), NPs-FAT (fatostatin equivalent dose at 25 mg/kg), and p28-NPs-FAT (fatostatin equivalent dose at 25 mg/kg). After 7 days of tumor inoculation, the treatment was conducted 3 days per week for 4 weeks. In addition, we performed IVIS imaging of intracranial tumors at 1, 3, and 5 weeks after tumor inoculation to observe tumor progression. IVIS was also used to carry out imaging of IR780-loaded NPs. The mice were monitored regularly and euthanized when they exhibited severe neurological symptoms and/or obvious weight loss (>20% of their body weight). We sacrificed a separate cohort of mice five weeks after tumor inoculation for pathological staining (n = 3).
Click to Show/Hide
|
||||
| Response regulation | Fatostatin induces ferroptosis by inhibiting the AKT/mTORC1/GPX4 signaling pathway in glioblastoma. In addition, fatostatin inhibits cell proliferation and the EMT process through the AKT/mTORC1 signaling pathway. | ||||